(1/3) China vs Japan: the bullish decade
What Chinese economists can learn from the US rather than Japan & implications for investors
Many analysts predict that China is headed for its own lost decade; others liken the bursting of the real estate bubble to the 2008 financial crisis.
While tempting parallels exist, neither analogy is fully accurate. Amid much gloom and doom around China’s economic headwinds, we aim to provide important data points that popular narratives have missed, and what the implications are for investors.
Focus on productivity, not the medium of exchange
A simple yet important concept to keep in mind before we dive into the analysis.
Imagine you are a subsistence farmer. You grow roughly one ton of food per year, and your family – a wife and three children – consumes one ton of food each year.
Your whole family helps, with your wife and kids foraging for fruit and catching fish.
Because food can get tight at times, and to keep the little ones’ spirits up, you play a game in the family, using pebbles as your currency, with which you can trade with each other.
Clearly, if you grow less than what you need (or eat more than you grow), at least some of your family go hungry. If you grow more, then you have a surplus.
Evidently, your family does not usually go hungry from a surplus (Yet Chinese “overcapacity” is an extremely popular narrative. We shall return to this discussion later).
Note that the medium of exchange within your family does not matter so much – you can just as well use shells instead of pebbles. Instead, what matters is your productivity.
You can sell your surplus produce, and buy some apples at the village market. Incidentally, your favorite vendor there would even allow you to run up a tab.
Unfortunately for Japan, during the perfect storm it ran up the tab and also allowed its produce to be priced out of the market.
Japan: the family that ran up the tab
Japan enjoyed a prolonged period of growth as it industrialized, using an export-driven model centered around national champions supported by keiretsus, tightly-knit business alliances in diversified sectors.
After the Plaza Accord in 1985, Japan and the US worked in unison to appreciate the Yen, which rapidly appreciated by 118% against the dollar, from a low of JP ¥263 in 1985 to a peak of JP ¥121 in 1988.
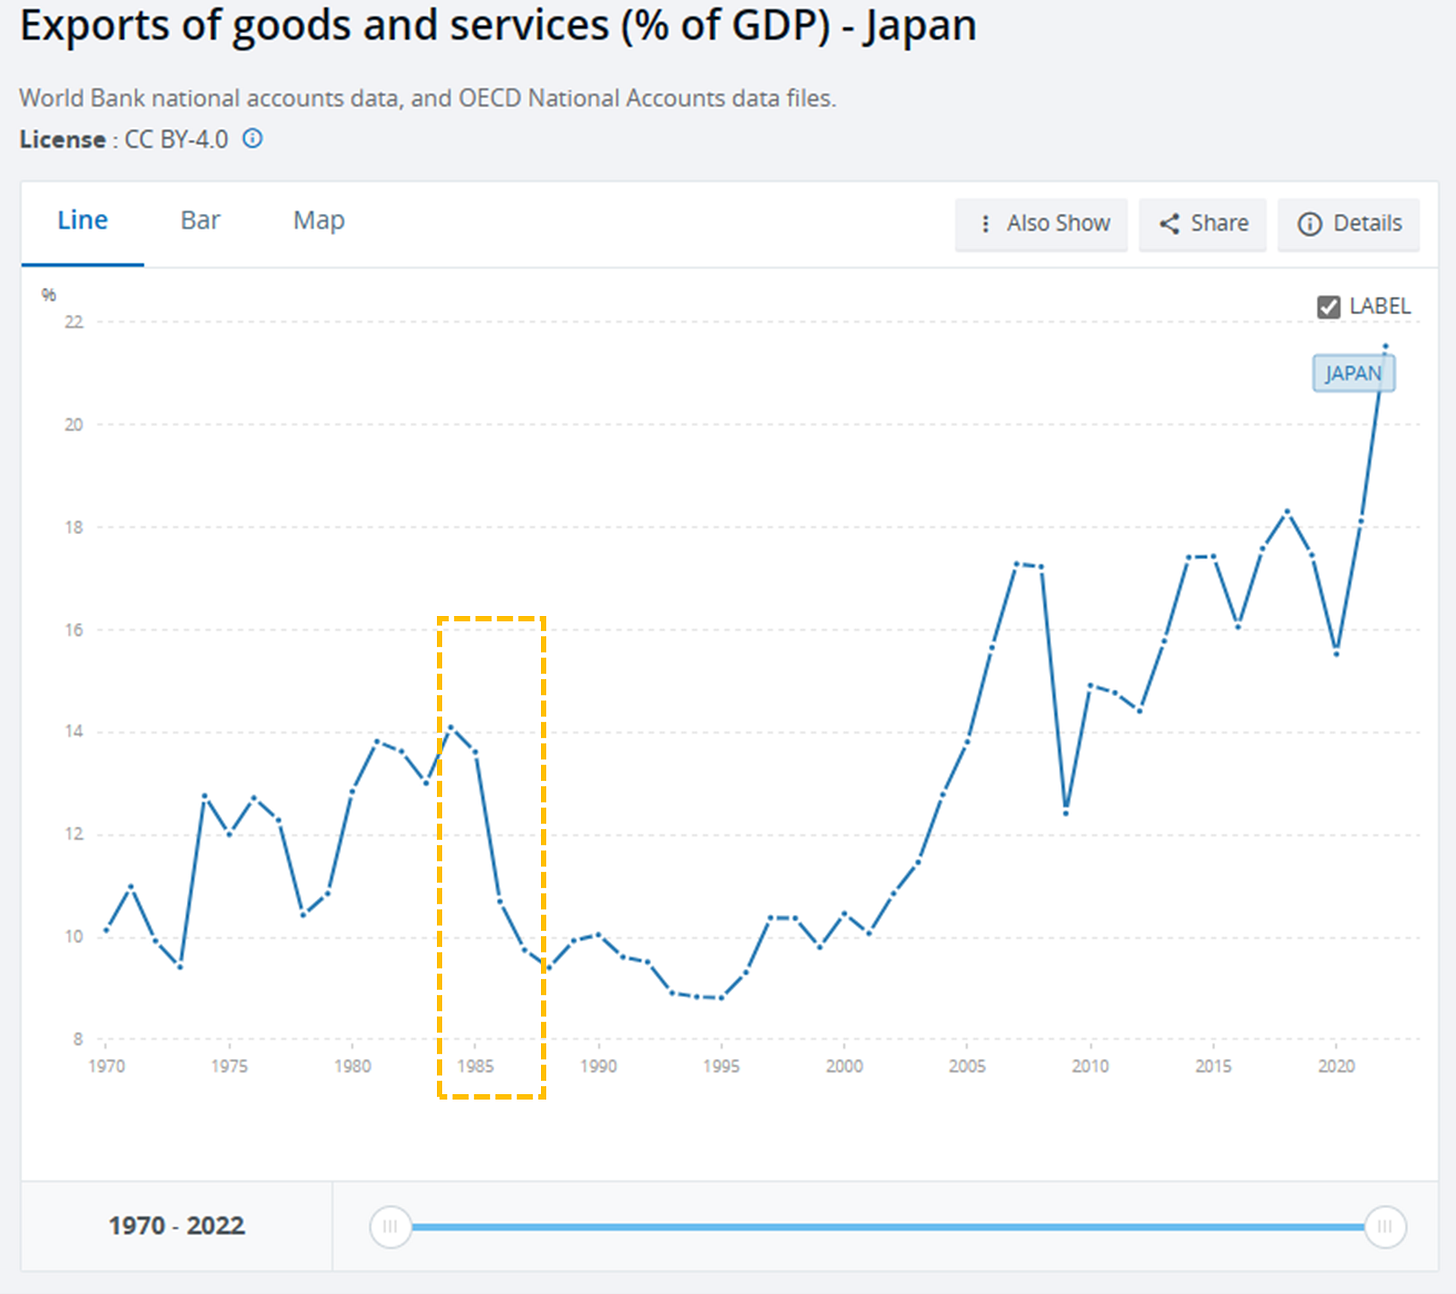
As a result, Japanese exports lost their allure for much of the rest of the world, which struggled to pay the increased prices.
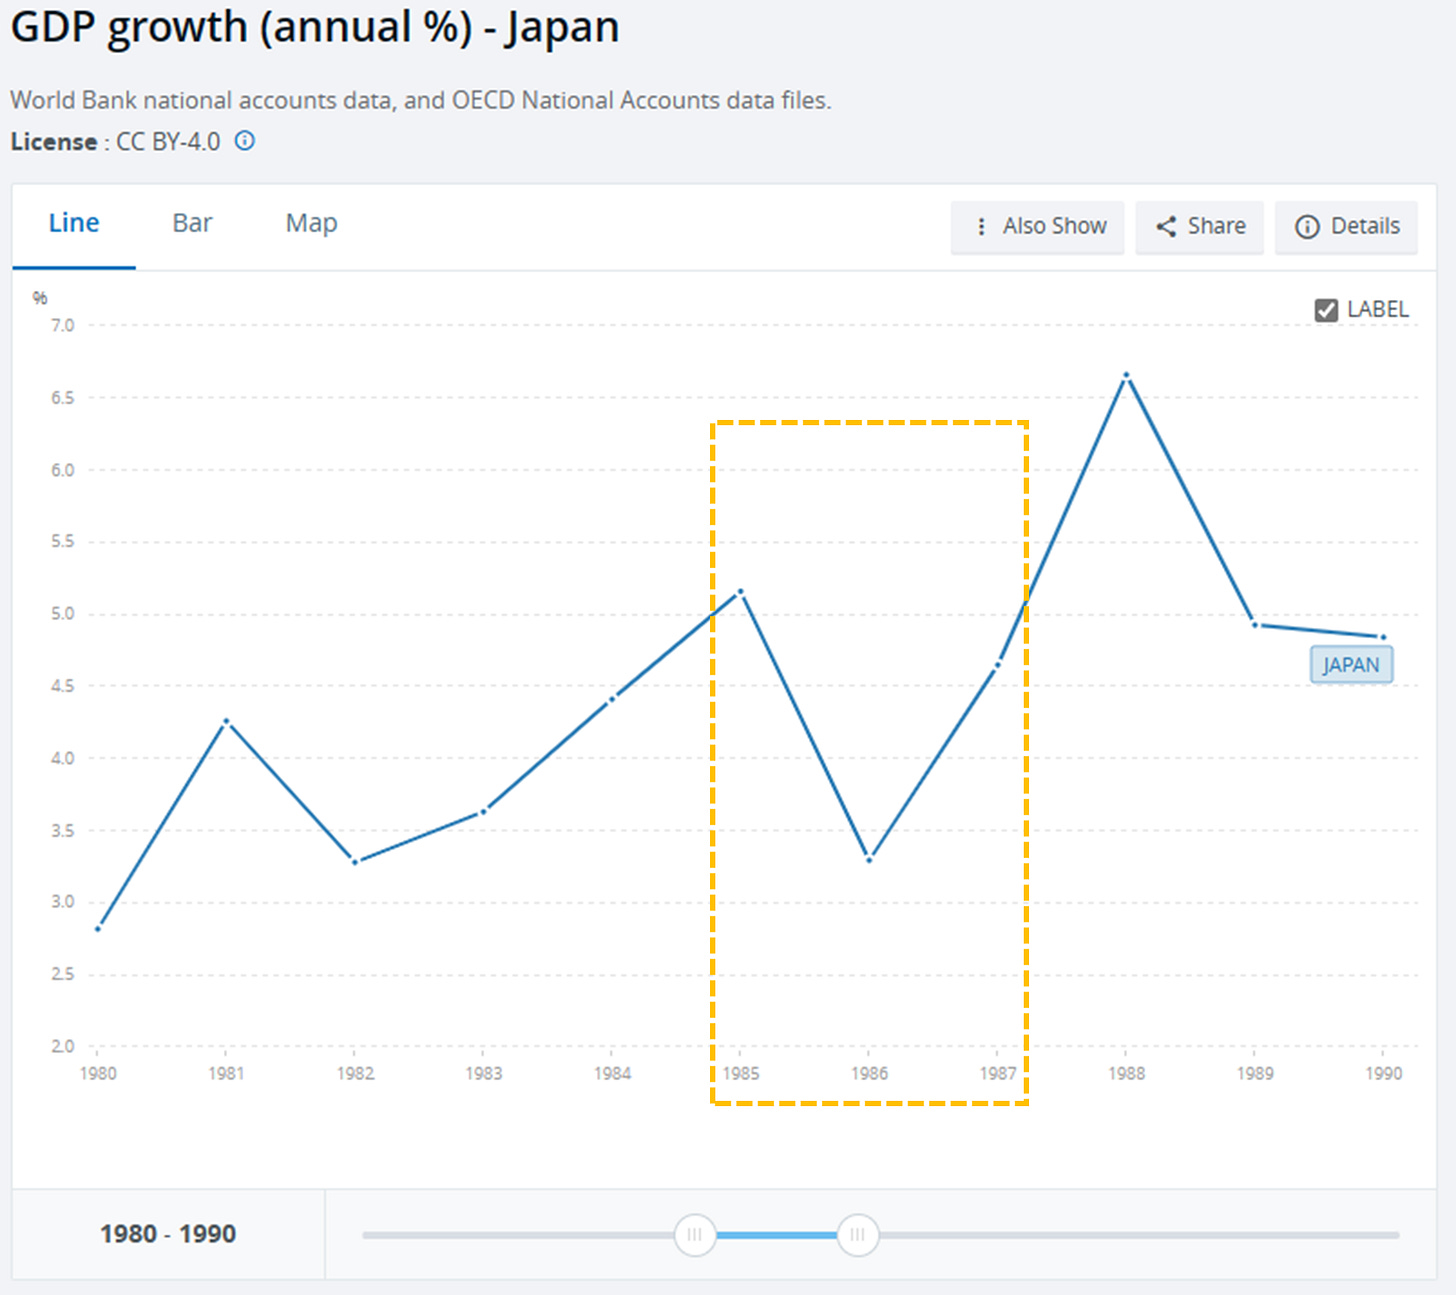
This triggered a drop in exports (and an increase in imports), with year-on-year economic growth in 1986 falling to 2.6% (according to the Japanese RIETI; the World Bank cites 3.3%), the lowest for Japan since 1975. The drop can clearly be seen in the chart below.
Consequently, Japan decided to use strong stimulus to counteract the feared hard landing, cutting rates to a then-record low of 2.5%.
By 1987, GDP growth was on its way back up.
However, Japan then followed up with even stronger fiscal stimulus – accounting for over 18% of total government final consumptions of the year prior.
“A large fiscal package was introduced in 1987, even though a vigorous recovery had already started in the second half of 1986. By 1987, Japan’s output was booming, but so were credit growth and asset prices, with stock and urban land prices tripling from 1985 to 1989.”
-International Monetary Fund
Meanwhile, the strong spending power of US consumers meant that they kept buying Japanese products, even though a key aim of the initial agreement was to lower the US current account deficit with Japan.
The years of excess soon followed. The Nikkei rose to record levels not broken until this year. Property prices also boomed.
Tales of Japan in those years were legendary. People lined up to hail taxis, waving 10,000-yen bills. Companies tried to woo graduates with gifts and even expensive trips abroad; the top tier of potential hires were packed off to Hawaii.
Overconsumption and excess may seem strange, given Japan’s still relatively low household consumption to GDP, yet export -driven economies quite naturally have lower private consumption.
The list of countries with the lowest household consumption as a percentage of GDP in 2022 according to TheGlobalEconomy is shown below. Note the location of wealthy states like Qatar, Singapore, Luxembourg and Norway.
In short, the issue is using GDP directly as a metric.
Instead, a comparison of savings rates gives a very rough sense. Japan’s savings rates were around 35% of GDP in those years, compared to well over 40% for China, over 50% for Luxembourg, more than 60% for Singapore, and over 67% for Qatar nowadays.
Even so, Japan quickly increased private sector debt, from 143% to 187% of GDP, compounding the issue.
Meanwhile, the Bank of Japan hiked rates significantly towards the end of the eighties to cool down the asset bubbles, yet urgently reduced rates in a bid to slow down the collapsing stock and property prices.
While this would normally result in a weaker yen relative to the dollar, the US was also having economic issues of its own, and cutting rates with gusto. As a result, the yen appreciated significantly against the dollar from 1990 onwards.
As can be seen in the chart above, the Louvre Accord in 1987 briefly caused a depreciation in the yen against the dollar, before the even more aggressive rate cuts from the US caused the Japanese Yen to strengthen against the dollar until 1995, reaching a peak of under JP ¥80 to the dollar.
By 1995, the Japanese average annual salary at one stage exceeded US $50,000. In contrast, the average annual salary in the US was under US $28,000. Unfortunately for Japan, it had priced itself out of the market to be competitive.
It is difficult to measure productivity accurately: the most common measure, ratio of GDP to total hours worked, would be contaminated by elevated asset prices and higher than average wages.
It is, however, perhaps even more difficult to argue the case that Japanese workers in 1995 were more productive on average than US workers, let alone nearly twice as much so.
Worse, it had already used its stimulus measures, both monetary and fiscal, so there were no more easy outs. Its workers consumed quite a lot relative to debt and Japan’s still export-driven model, yet were now in heavy debt and no longer competitively priced globally.
Summary so far
Already we see some key differences with China:
One. China did not strongly appreciate its currency, but only trying to hold it steady above the lower end of the trading range, so the country is not similar to Japan in 1985.
Two. China’s workforce is certainly not the lowest cost, but still highly cost effective, so it is not Japan in 1995 either.
Three. China’s central bank has not used stimulus heavily, unlike Japan in 1987 or after 1991, giving it the optionality of when to act and in what way.
Notably, the convenient narrative that China has been intentionally suppressing wages and consumption - by intentionally keeping its currency low - is not entirely incompatible with the first observation, since it has instead been propping up the currency, and trying to promote domestic consumption for some two decades.
This narrative is often conflated with “financial repression”, which actually refers to policies that funnel funds to the government, via extensive intervention or regulation in financial markets, such as controlled interest rates, capital controls, etc.
We shall continue the comparison between Japan and China next week.
Full disclosure: This is not a solicitation to buy or sell. We have no current business relationships with the companies mentioned in this note, and are not paid to write this piece (other than paying fellow exponents of the research).
Disclaimer: This should not be construed as investment advice. Please do your own research or consult an independent financial advisor. Alpha Exponent is not a licensed investment advisor; any assertions in these articles are the opinions of the contributors.
Edit: An earlier version incorrectly referred to monthly rather annual salaries.


Astounding that Japan's average salary was almost double the US at one point.
"By 1995, the Japanese average annual salary at one stage exceeded US $50,000. In contrast, the average annual salary in the US was under US $28,000."