(2/3) China Outlook vs Japan Lost Decades
And what China can learn from the US
In this part of the series, we finish the Japan comparison. Our perspective is that of longer-term equity investors, but the findings would also be relevant for global macro specialists, traders and economists alike.
A quick review of our findings so far.
In the first part of this series, we analyzed what happened to Japan in the lead up to its lost decades, which can be summed up as:
Over-stimulus. The Plaza Accord and yen appreciation caused Japan to respond with forceful stimulus measures, to ease lower export activity.
Inflation of bubbles. These overshot and created three bubbles: the stock market bubble; the real estate bubble; the wage bubble.
Loss of competitiveness. The last bubble, combined with prolonged yen appreciation, is frequently overlooked but a key fundamental cause of the subsequent stagnation in wages & consumption, in turn a crucial driver of GDP.
Recall that:
Nominal GDP = Net export + Consumption + Government spending + Investment
We examine each of these four components in detail.
Exports - high wages and the rising yen reduced exports competitiveness, losing Japan its key growth engine of the previous decades.
Japanese wages became too high to be competitive, peaking in 1995, with the average wage at one stage over 80% higher than the average in the US, which meant that they would struggle to grow further in the following decades.
Consequently, the prolonged stagnation in wage growth became one of the defining features of Japan’s lost decades. Wages (blue line below) stopped growing soon after the mid-nineties
But though the labor share of GDP (red line above) decreased from 1983, and then again from the mid-nineties onwards, yen appreciation (and export controls) brought about by the Plaza Accord still dealt a strong blow to the export economy.
The chart above shows how yen appreciation hit exports (blue line depicting value of exports [1] and red line the strength of the yen), which did not recover above their 1985 levels until more than a decade later, when the yen weakened significantly. Unsurprisingly, there is a strong negative correlation.
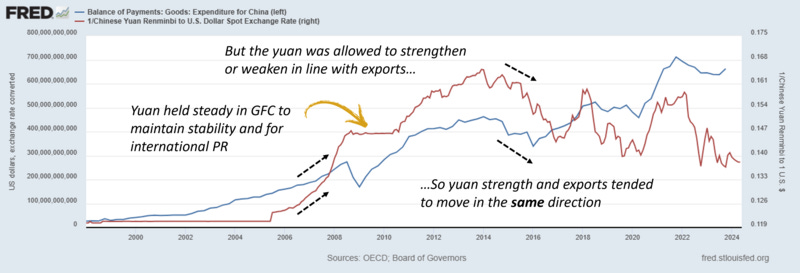
For China, however, the picture is somewhat different. Below is the chart of net exports (exports less imports) of goods for China – using a slightly different series than for Japan because the necessary period is not available on FRED.
In the chart above, the two have more of a positive correlation, with the strength of the yuan slightly lagging the net exports – this being due to the dollar peg and then currency band – the currency is allowed to appreciate when the net exports rise, and vice versa.
As we have already noted, currently the yuan is weakening (though the Chinese government appears to be propping it up), unlike the yen in 1992.
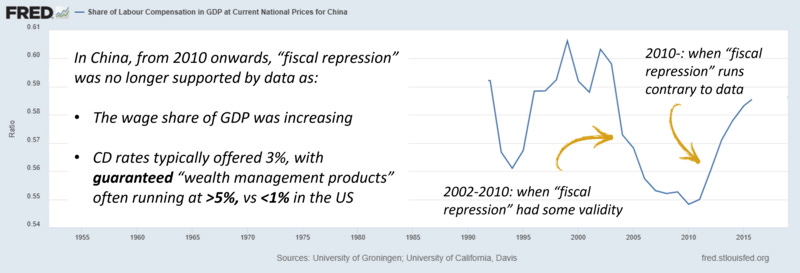
As above, wages form an increasing share of GDP from 2010 to 2016 - again inconsistent with the popular “fiscal suppression” narrative - during which period increasingly well-off consumers tended to trade up, allowing consumption to become a key driver.
For more recent years, a 2018 Nikkei article reported that the Chinese wage share of GDP was “reaching US levels”; a 2019 ASR / OECD analysis also shows that the wage share of GDP remained high in China - indeed, one of the highest post-tax.
Combined with the relatively low costs of education (e.g., a full year’s university tuition would usually be under US $1,000 in China, vs US $10,000-40,000 for the US) and healthcare (e.g., extracting an incisor would typically cost US $15-40 in China, vs $75-200 in the US) in China, the potential for consumption-driven growth is significant.
This provides a good segue back to Japan’s lost decades.
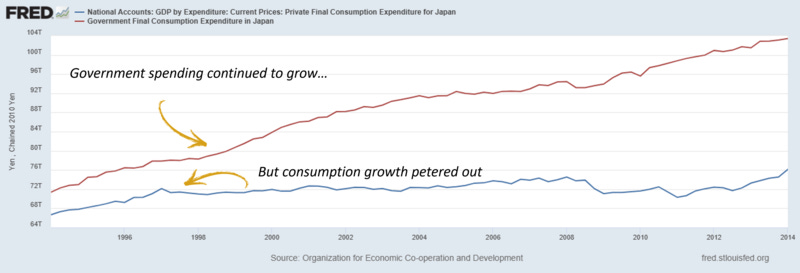
Consumption and Government spending - though government spending grew steadily in Japan, consumption growth faltered during its lost decades.
Government spending drove up public debt levels. Furthermore, excessive investment in infrastructure in places (the famous “roads to nowhere”) led to a double-whammy of both longer-term maintenance costs, and interest payments.
For China, instances of over-investment in public infrastructure, e.g., local new tramlines being built, only to be decommissioned within a couple of years in Shanghai, can also be found.
These would affect China in the same way they did Japan, and is presumably why now local authorities require central approval for most infrastructure projects.
Overinvestment in local infrastructure, the resultant maintenance costs, and debt-laden Local Government Financing Vehicles (LGFV) balance sheets form a key risk.
However, the economic impact of China’s Belt and Road Initiative (BRI) is often misunderstood.
Imagine a BRI-funded railway in Nigeria: its economic impact can be separated into a domestic and an international component. From China’s perspective, the domestic component would usually create a single-year GDP boost for materials and labor.
Meanwhile, the international component would not directly impact China’s GDP, except indirectly, such as allowing for increased exports, or generating ROI over time.
In general, for BRI projects, China would not be shouldering the longer-term maintenance costs, nor interest payments for the debt taken on. Instead, these would be borne by the Nigerian authorities, so there is limited direct drag on longer-term GDP growth for China itself as a result of BRI projects, on government spending.
We shall return to the BRI to investigate the the impact on the balance sheet of creditors - the policy banks - in the investment section, but let us for now turn to consumption.
Consumption in Japan initially rose until 1997, after which faltering income and export growth brought it down.
One person’s consumption is another’s income - so wages and consumption often move in lockstep.
The peaks in wages and employment in the first half of 1997 as above corresponded to a last export surge, thanks to the strong US and western European economies.
Thereafter though, the Asian Financial Crisis weighed down both Japanese consumption (red line above) and incomes (blue line above). Deflation ensued thereafter, further dampening consumption and entering a deflationary spiral, with the aging (and declining) population in later years creating even more headwinds.
But even as incomes fell in both yen and dollar terms, recall that consumption remained fairly stable after 1998, driving the decrease of household savings rates. Soon, interest payments began to exceed receipts (first two charts on the left below).
Even before this, by the early nineties, Japanese government expenditures began to exceed revenues, so public debt accumulated (chart to the right above).
However, the Japanese response arguably also missed out on a powerful tool that the US demonstrated during the pandemic (at least before corporates racked up considerable foreign-denominated debt).
Direct stimulus checks (or consumption vouchers, which do not cause as much asset inflation) are the most direct way to promote consumption and combat deflation.
QE, which Japan pioneered before the US, causes asset inflation, but not price inflation. However, QE and lower interest rates failed to generate increased consumption, because even if rates are low, consumers are unwilling to take on increased debt to spend, without prospects of future income growth.
If your income is falling, would you increase borrowing to up your spending?
This commonsensical observation seems to have eluded many economists and policymakers throughout history.
On the other hand, for China, the underlying fundamentals are somewhat different, despite certain parallels. The share of GDP from consumption increased until 2019, after which it fell, due to the pandemic.
Deflation also appeared, but comparatively much earlier than for Japan, where it showed up around five years after the bursting of the real estate bubble. For China, it appeared in virtually the same year, reducing the chances of a prolonged slide.
This is another difference that has escaped the attention of many analysts.
In which year did the Japanese lost decades start?
There were multiple potential starting points:
The lost decades for equities began in 1990 (but consumption kept rising)
The lost decades for real estate began in 1991 (consumption still rising)
The lost decades for dollar-denominated GDP began in 1996 (consumption still rising)
The lost decades for consumption and wage growth began in 1998
But in China most of the trouble started in 2022-2023, though GDP held up and equities were not overly bubbly (offshore Chinese equities were probably in a bubble in 2021, but onshore equities did not reach such frothy valuations). Consumption did suffer from an earlier depression, but that was more pandemic-driven.
Such a compressed timeline is more similar to the 2008 financial crisis, which started with the crash in US real estate. However, for China it was not the financial sector that bore the debt, but the LGFVs, Chinese-style “trusts’, and the real estate developers.
Additionally, while Chinese households have taken on considerable mortgages, their balance sheets are still healthy enough to not preclude the possibility of consumption-driven growth, as we shall see.
Indeed, consumption grew strongly from 2010-2016, before another major round of housing price increases throttled its growth, and necessitating higher levels of saving for households.
On the other hand, home ownership rates in China are very high at over 80%. Moreover, in 2022, according to the Asian Development Bank, over 50% of Chinese household debt was in housing – due to the rapidly growing housing prices.
Falling housing prices hurt consumer confidence, especially those who have taken on substantial mortgages. So consumption from many homeowners, at least in the short term, will be negatively affected - which of course then dents incomes (one person’s consumption is another’s income).
The current state of household balance sheets determines how quickly confidence can be regained - another key challenge - to revitalize consumption and wage growth.
So is a Japan-style “balance sheet recession” inevitable?
Taking a step back, from the IMF data as below, the household debt as a percentage of GDP is now over 60%, and apparently very close to the 70% of Japan during its lost decades.
However, as the analysis from Seafarer funds shows, due to the high savings rates in China, the balance sheets of Chinese households remained healthy in aggregate [2], despite the growth of housing debt.
Interestingly, despite falling starting salaries and rising youth unemployment, the Chinese leisure industry saw a recent boom as younger non-homeowners decided to splash out on experiences, rather than attempt to save for downpayments on real estate.
Versus Japanese households at the beginning of the lost decades, Chinese households had accumulated much more savings. So much so, that in aggregate, household liabilities can be paid off in full, with just cash and deposits (of course this is not necessarily true for individual households, so there will be a drag on consumption).
How did this come to be?
As shown below, the Japanese household savings rate declined consistently starting from around 15% in 1985.
Contrast the savings rate of Japanese households above with Chinese households below.
The savings rate for Chinese households never really dipped below 27%. After shooting up during the pandemic, it gradually fell back as consumption resumed, albeit unevenly, and at a lower level than pre-pandemic.
Consequently, even after decades of household deleveraging, Japanese households still had a higher level of consumption-suppressing debt than Chinese households.
Of course, to kickstart consumption again, the Chinese government also has the option of stimulus checks / consumption vouchers, making a “balance sheet recession” quite avoidable.
To sum up, this means that negative sentiments from falling real estate prices will weigh upon homeowners, and hit consumption in the short term.
However, as this normalizes, healthier household balance sheets allow for a much faster recovery in household consumption in China now than Japan then, though it will also face headwinds from the aging and declining population.
Investment – the flagging economy and deflation of asset bubbles drove capital overseas in search of higher returns, eventually causing underinvestment at home.
The below shows the principal component of investment (without the noise from inventory and valuables fluctuations), showing a secular downward trend after 1996.
Note that high outbound investments (apart from a brief spurt during 1987 to 1990) were not so much a cause as an effect of the lost decades.
Japan’s strong yen and high wages did not only affect net exports; because Japanese manufacturing became much more expensive than elsewhere in Asia, Japanese firms and MNCs shifted investment there.
Furthermore, because of the deflation of the real estate and stock market (important as exit liquidity for private equity) bubbles, domestic investors became more reluctant to invest in these risk assets.
This resulted in a period of prolonged underinvestment at home – from the chart below, PP&E investment declined. Yet as we noted previously, there were signs of overinvestment in infrastructure.
This apparent paradox can be resolved by noting that public investments in infra would come under the burgeoning government spending category. Meanwhile, the private sector, especially “zombie” companies and banks are underinvesting.
Additionally, due to the Japanese traditions of lifetime employment and keiretsus – creditors, which often came from the same alliances, were unwilling to push debtors into bankruptcy. This meant that debt-riddled companies shied away from investment, even as they kept operating and saved jobs.
A commonly neglected point: Japanese overseas investments had very different longer term impact than BRI projects, especially on balance sheets, and were driven by the private sector.
Meanwhile, the typical BRI project would be typically structured as a set of Chinese companies providing materials and labor, with one or more of the policy banks providing financing.
To use the Nigerian railway example, it could be the China Railway Construction Corporation, and its suppliers building up the railroad – with Chinese financing, say the Exim Bank, which would usually pay them directly.
This means that the real economy does not get saddled with liabilities from BRI projects, unlike many overseas investments that came back to haunt Japanese companies.
Take, for example, Toshiba’s regrettable acquisition of Westinghouse. This loaded its balance sheet with debt, and was a major contributory factor in the downfall of a long-esteemed Japanese conglomerate.
More generally, foreign-denominated debt, arising from overseas buying sprees, meant that the Bank of Japan could not easily help corporates inflate debt away; instead, an increased yen supply, and thereby yen depreciation – would mean that any dollar or euro debt burdens would increase.
Chinese commercial banks do not generally underwrite the primary risk for BRI projects.
So even in the worst case, if the ROI is negative, the borrowing nation is unable to repay, and the debt must be marked down, there is little chance this will clog up the Chinese financial system, unlike zombie banks for Japan.
This is because BRI risks are largely isolated to the policy banks (the CDB, the Exim Bank, and the ADBC). Even under extreme stress situations, these can be recapitalized by the Chinese government with limited impact to the rest of the financial or real economy - and the policy banks’ primary objective is not profit maximization.
Although commercial banks may at times provide syndicate loans and ancillaries, because all those are funneled through policy banks, the latter can be directly bailed out if the need ever arises, with little risk of contagion to the rest of the financial sector.
A further consideration is that household investments in financial assets, while relevant for investors, do not appear in the GDP equation at all.
These only represent the exchange of goods and services, not the production and consumption, which is what GDP measures, so they are not included under the investment category of the GDP equation.
However, they are clearly of particular interest to investors. Indeed, Japanese households, burned by the asset bubbles, grew to strongly prefer Japanese government bonds over any risk assets like equities.
Investments in real estate, which would be counted in the GDP equation, also fell with the bursting of the bubble and falling prices. In the later years, a declining population exacerbated this issue.
Since Chinese equities tend to be disproportionately driven by retail – unlike developed markets like the US – whether the Chinese government will be able to entice them to invest their savings in equities rather than time deposits is the key question.
So far, retail investors have largely stopped using housing as investment, as implied below by the sluggish growth in new mortgages, but savings are now flowing into time deposits, not equities.
Despite superficial similarities in Japan and China, deeper analysis shows a different set of challenges.
Exports. Japanese export competitiveness decreased greatly due to the wage bubble, yet Chinese export competitiveness remains very high, though may be vulnerable to tariffs.
Government. Japanese government spending was a consistent engine – though there was arguably infra overinvestment.
The Chinese government has been slower to ramp up government spending like during the GFC, partially due to the ongoing restructuring in LGFVs, and partially due to high existing infra investment.
Consumption. Japanese consumption and income growth stalled in tandem, as households had unhealthy balance sheets. Chinese consumption appears to have faced an abrupt decline, because falling housing prices hit consumer confidence.
Household balance sheets are healthier, so a consumption-driven recovery is still possible. If and how the government chooses to stimulate spending is the key; US pandemic-era stimulus checks, for example, have proven to be highly effective in combating deflation and generating spending.
Investment. The deflation of the real estate bubble is a key similarity between Japan and China, and means short term pain. Yet if it can pull off a solid deleveraging, there are two longer-term silver linings for China, enabling shifting away from debt- and housing-driven growth.
Firstly, housing prices were too high and depressing consumption; lower housing prices will allow consumption to become a growth driver. Secondly, it allows the Chinese government to more easily direct investors into the stock market, which saw its last bubble in 2015.
Elsewhere, the comparing the Japanese outbound investment to the BRI is a red herring.
Though BRI’s efficacy in creating new export markets (and ROI) remains to be seen, its impact is more like a single-year government spending boost, and does not create maintenance costs or load the private sector with debt, as was the case for Japanese outbound investments.
We see the three top challenges as being restructuring LGFVs, regaining consumer sentiment, and reorienting towards an aging and declining population.
LGFVs in the short-term. A previous chart showed high levels of debt in non-financial corporates: those included real estate developers, China-style “trusts” and local government financing vehicles (LGFVs).
Consumer sentiment in the mid-term. Consumer confidence weighs on both household spending and allocation towards risk assets, so the government will have to find effective ways of stimulating demand and entice households into equities.
Aging and declining population in the longer term. This trend would lead to an increased dependency ratio, which will create a drag on both consumption and productivity that would be difficult to reverse. In the longer term, many consumer companies will likely be forced to premiumize to maintain profitability.
How do you feel about China’s outlook? Let us discuss in the comments.
In the final part of the series, we shall finish the analysis, further broadening the comparison set to Italy and Russia, which experienced their own lost decades, lay out our outlook for the future, and what all this might mean especially for equity investors.
[1] To clarify, this is somewhat of a simplification since it should be net exports of both goods and services that would be used to calculate GDP, but serves as an adequate proxy – the preferred series on FRED is not available for this period.
[2] This remained true until 2019 when the data series ends, which is only a year away from the peak of household debt in 2020.
Full disclosure: This is not a solicitation to buy or sell. We have no current business relationships with the companies mentioned in this note, and are not paid to write this piece (other than paying fellow exponents of the research).
Disclaimer: This should not be construed as investment advice. Please do your own research or consult an independent financial advisor. Alpha Exponent is not a licensed investment advisor; any assertions in these articles are the opinions of the contributors.
Edit: Corrected an accidentally repeated paragraph, and clarified effects of aging & declining population


what do you think about the avalanche of tariffs? to me they look very problematic for the China's export driven growth model, not to mention that they also lower disincentives to go into a (world) war...
do you think that government even care about stocks?
Consumer confidence weighs on both household spending and allocation towards risk assets, so the government will have to find effective ways of stimulating demand and entice households into equities.