
(1/2) 100+ quality investment & business analysis resources
Top-notch free & paid resources for professionals & retail investors alike.

Fellow exponents,
GIGO - ‘Garbage In, Garbage Out’ - is a concept that holds true in many disciplines, not least of which investment research.
Poor sources can be misleading or incorrect, which lead to the wrong conclusions & unsound investment decisions, ending in regret over lost time and money.
We list our favourite resources here to hopefully save you all three.
The delectably self-illustrative💰(greater number = higher cost) indicates paid or freemium sources with limited free offerings, but given our habitual inclination towards finding value, most of these resources have that magic price of precisely zero.
This is not to detract from premium providers such as Bloomberg (typically >$20k a year per user) or GLG (typically >$0.5k per hour).
Each have their place, though we focus on sources more suitable for portfolios under $1B, and any investment or business analysts.
Let’s go,
Active Alpha Research
p.s. Please subscribe, like and share if you find this post useful.
How to use this list
The list is relevant for a vast range of strategies - we shall cover potential investment processes in future posts, but here are three simplified possibilities:
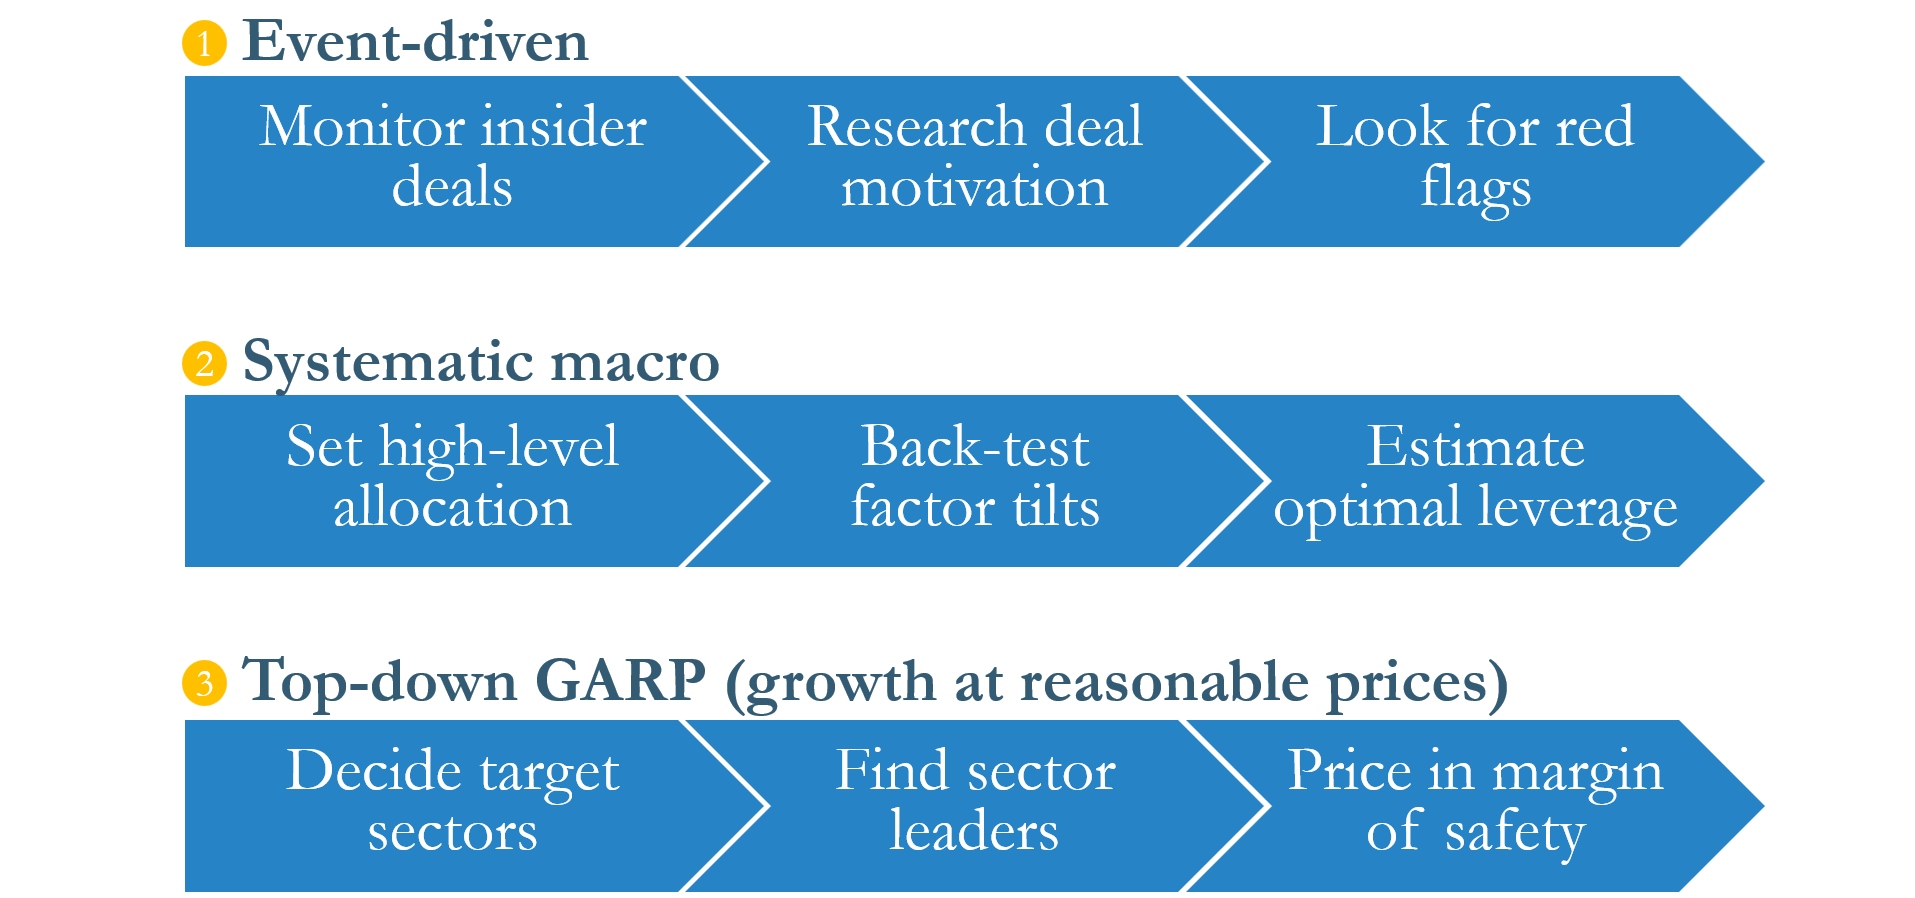
Source: Active Alpha Research
Active Alpha’s aims to help you find your edge, and the style that suits you.
Sources are categorised based on our preferred usage (though there is overlap), and ordered by descending relevance to the readership at large and that specific use case.
I. Macro data
Usage. Frameworks like the Merrill Lynch Investment Clock below or Dalio’s investment quadrants help investors to decide which asset classes might be ‘in’ for the period ahead. Prominent value investors warn against timing the market, yet this is what most professional investors just have to do.
Other uses include longer-term trendspotting, total addressable markets sizing, cross-geo/sector benchmarking, or as early warnings (e.g., Buffett Ratio). Systematic macro or sector rotation strategies can be directly built on higher-frequency macro data.

Source: Merrill Lynch
Limitations. It can be tricky to identify which stage of the cycle we are in, there can be discrepancies across even similar frameworks, and it pays to check whether the established wisdom turns out to be fallacious under specific circumstances.
Macro surprises can drive short-term market moves, so discretionary macro traders will need to be aware of both the consensus and the latest news. Meanwhile trading individual stocks on macros alone is highly inadvisable.
Federal Reserve Economic Data (FRED): provides over 800k macro time series, with up to daily updates. With markets so Fed-driven, Active Alpha believes it highly worthwhile getting the info straight from the horse’s mouth. Graphing, Excel add-in & API access are all provided free - thanks Uncle Sam!
OECD: supplies data FRED above, focusing on OECD economies so China is often AWOL. Analysts may find the leading indicators to be especially pertinent. Meanwhile, EUROSTAT focuses on Europe, and ASEANstats the SEA.
Commodity Futures Trading Commission: publishes the celebrated Commitment of Traders Reports (COTR), listing traders’ positions in various futures. China (#1 global commodities importer) market counterpart here.
Statistics and Census Bureaus: US, China, Japan, Germany, India, UK. The US Bureau of Economic Analysis has weekly & monthly spending by industry.
Damodaran: provides data like asset class returns, and industry and regional level breakdowns. Data typically updated each January, hence better for historical research, or informing year-ahead allocation than for live trading.
💰TradingEconomics: 20M indicators. We use them as a sense check, or when a particular series is not available from other sources ($499/year).
World Bank: tends to conduct one-off studies that may help inform a single big trade. Also has population projections & annual development reports.
💰💰💰Economist Intelligence Unit (EIU): offers macro data & projections to help inform TAM estimations or geo-based ETF strategies.
💰💰💰Oxford Economics (OE): supplies data somewhat similar to EIU. May not provide the cross-cut data (e.g., geography × age × income × year), so combination with other sources for interpolation needed at times.
Other: the University of Minnesota has its own compilation here. The International Labour Organisation provides labour-related data split by geography and demographics; Also has light industry briefs.
II. Trends, industry reports and databases
Usage. Market sizing and competitor comparisons, and to get a feel if forecasts sound plausible (e.g., seeing growth ahead due to low current penetration) or are too rosy.
Limitations. Expensive paid sources are the norm. Large institutions especially like to purchase expensive and informative datasets like US credit card spending data. While it is tempting just to consult Bard & Copilot, these are unfortunately exceedingly good at plausibly hallucinating.
Google Trends: has global, near real-time data. Google rebases to 100 the highest traffic in the lookback period, and only provides relative search volumes, though unofficial estimates for absolute figures exist - see gtrendR (coding needed).
Active Alpha prefers the Baidu Index for China & for Korea would also consult Naver.
Regulators: invaluable for regulated sectors, such as financial and utilities - e.g., FDIC for US banks, the FCA for the UK, the FSA for Japan, and the CBIRC for China. Government bodies and watchdogs tend to be free while SROs charge.
💰💰💰Euromonitor International (EMI): offers market & category data for consumer-facing industries. Somehow simultaneously much-maligned & seen as the premier source.
Anecdotally, Active Alpha has on multiple occasions interviewed $1k-a-pop industry insiders via expert networks, and heard directionally different opinions from EMI - only to discover upon cross-checking with multiple insiders that EMI was right.💰💰💰GlobalData: focuses more on the distribution channel versus EMI (which is more brand- and category-centric), and hence quite complementary. Retail and energy data are especial strengths.
💰💰💰Data.ai: specialises in analytics (competing apps, user profiles & behavioural trends, etc.) for mobile apps, covers all major markets.
💰💰SensorTower: covers NA well but other markets can be spotty. Offers an indie starter package (prices change frequently), though we have only used the full-fat version. Other options include AppLovin, AppsFlyer and Apptopia.
💰💰SimilarWeb: provides website analytics. Semrush another option, while sitelike offers a free way of identifying online competitors for any given website.
💰Statista: supplies wide range of charts. Useful for identifying competitors & quick sense checks, though citing Statista for a formal study can lead to more than one raised eyebrow in the room.
💰💰💰NielsenIQ: offers retail data for consumer products, ultimately constructed from actual POS data. Active Alpha has only used the offline data preciously. SPINS and IRI are competitors but have a slightly different focus. The related Nielsen company provides TV and online media viewership data.
💰💰💰iResearch: provides specialised coverage of China through research reports and data, covering both mobile and desktop users.
III. Institution and insider transaction data
Usage. Company insiders and institutional investors are seen as the ‘smart money’, so their buying company stock may be used as the first sign to prompt further research. Insiders selling may be potential red flags.
Limitations. The 13-F is only filed quarterly, so the exact transaction price is not known, and it might have moved due to reporting lag. Political buying for optics, or selling for personal reasons can also be noisy.
Securities and Exchange Commission (SEC): The ultimate source of multiple analytics platforms below, a veritable cornucopia of information. Pour gratuit.
EDGAR: database of company filings - counterparts in other markets include e.g., Japan with EDINET, and the UK with the NSM.
Form 4 archive: insider transactions.
13-F archive: quarterly holdings report for firms with AUM > $100M.
Stock exchanges: Nasdaq, Shanghai Stock Exchange, Tokyo Stock Exchange, Shenzhen Stock Exchange, National Stock Exchange (India), Hong Kong Stock Exchange, Bombay Stock Exchange, etc. LSEG sells insider holdings data for the Asian, Canadian, South African, UK and US markets as well.
Insider Screener: specialises in insider transactions covering North America, Europe, Australia, and India.
Open Insider: focuses on US listings, and based on SEC form 4 data.
Eastmoney: follows insider and institutional holdings (and a lot of other market data) in China, where it is a top financial media outlet.
WhaleWisdom: tracks major funds, and allows construction & backtesting of custom fund-of-funds; paid version provides proprietary indices (from $300 / year).
HedgeFollow: monitors well-known investors and estimates buying price.
Stockcircle: offers similar product to HedgeFollow, more emphasis on whales.
DATAROMA: tracks investors, though only provides end-of-period share prices (no transaction price estimates).
Holdings Channel: tracks both latest investor and insider transactions. Retro feel, but data nicely formatted & ready to copy & paste into Excel (as below).

Source: Holdings Channel

In the next post, we shall continue with:
IV. Stock screeners and backtesters
V. Fundamental and market data providers
VI. Deals and company profile databases
VII. News providers
VIII. Communities
IX. Fund philosophies and strategies
X. Where red flags might be found
Update: Part two has just be released - read it here.
Disclaimer: This should not be construed as investment advice. Please do your own research or consult an independent financial advisor. Alpha Exponent is not a licensed investment advisor; any assertions in these articles are the opinions of the contributors.