
(3/3) China vs Japan: Making Predictions
Lessons from Japan, Italy, Russia and the US - and an eye on strategic sectors

Continuing from the first and second parts of this series, we now address:
What are the similarities and differences between China now, and the lost decades for the comparison set (Japan, Italy and Russia)?
Given these insights, what can we expect for the Chinese economy going forward, and what are the insights from the GFC?
What sectors would be potentially promising for investors in Chinese equities?
Now we analyze multiple countries that have suffered a lost decade, to minimize the chance of overfitting to Japan, and confusing noise for signal.
We pick Japan, Italy and Russia because they all suffered from a lost decade or more from the nineties onwards. It also helps that they were facing a broadly similar external environment over this largely contemporaneous period. Additionally, we also go on to see what happened during the lost decade for equities in the US.
Below are the GDP charts (in US dollar terms) for China and our comparison set.

The post-pandemic growth has clearly been much slower, but because the chart is in constant dollar terms, the flattening of the trajectory would appear less extreme in local currency terms - the dollar has appreciated in the meantime.

Japan’s chart is quite telling. The lost decades in terms of economic growth did not start in 1990, as is commonly cited (though the stock market lost steam after 1989). Instead, GDP growth faltered only after 1995.
As we have mentioned before, there is a time lag across the bursting of the property, stock market and wage bubbles.
Worthwhile also noting here that both the Japan economy then and the Chinese economy now leaned quite heavily on exports.

Italian GDP saw three flatter periods: from 1980 to 1985; from 1992 to 2001; from 2008 until now. The period that we are most interested in is 1992, which matches quite well with the Japan years.
Unlike the Chinese economy, Italy was famous for its once-chronic current account deficits. Interestingly, during its own lost decade, from 1993 to 1999 Italy was running an unusual current account surplus – yet this corresponds to a mid-decade period of GDP growth from the trough in 1993.

Russia’s GDP in the chart above belies the devastating hyperinflation, particularly in 1992, when retail prices increased by over 2500%, and entire lifetime savings were effectively wiped out.
However, it is clear from the chart above that GDP growth fell until 1999, one year after Russia opted to default on ruble-denominated domestic debt, which also wiped the slate clean to enable a fresh start.
Incidentally, this highly unusual decision surprised many economists who thought such a default is almost impossible, and wiped out LTCM in the process.
A holistic comparison across the economies through salient features reveals important similarities and differences.

Overall, it is clear that while China and Japan do bear similarities, there are aspects that may be more comparable to Italy or even Russia.
Asset inflation. Like Japan, China in 2024 has had an real estate bubble, yet like Italy and Russia, does not suffer from a stock market bubble.
Price inflation. Importantly, unlike Japan in 1992, China is not seeing an inflated cost of living. Contrary to prevailing impressions, deflation in Japan only kicked in from 1995 onwards, and became a perennial problem after the onset of the Asian Financial Crisis, not in 1992. China’s situation is different from Italy and Russia as well, which did see price inflation, due to currency devaluation and hyperinflation respectively. On the other hand, like Italy and Russia, it is not seeing inflated wages.
Currency and trade. Like Japan and Russia (albeit for natural resources), China is reliant on an export-driven model, and its currency is facing prospects of depreciation like Italy and Russia, unlike Japan.
Forex debt. China’s forex debt situation is most similar to Japan and Italy. We focus specially on forex debt rather than domestic debt, since it would be far more difficult to inflate away.
Savings and stimulus. Chinese household savings exceed that of the other economies on a like-for-like basis, and stimulus has not yet been deployed, making these aspects different from the other economies.
Overall, then, we see that present conditions in China are also somewhat similar to Italy, though China has higher household savings and open stimulus options, both of which Italy did not have.
Next, we examine what impact the economic conditions had on the stock markets.
Going long Japanese equities in 1992 and holding until 2002 would likely have lost you over 20%, or around -2% p.a.
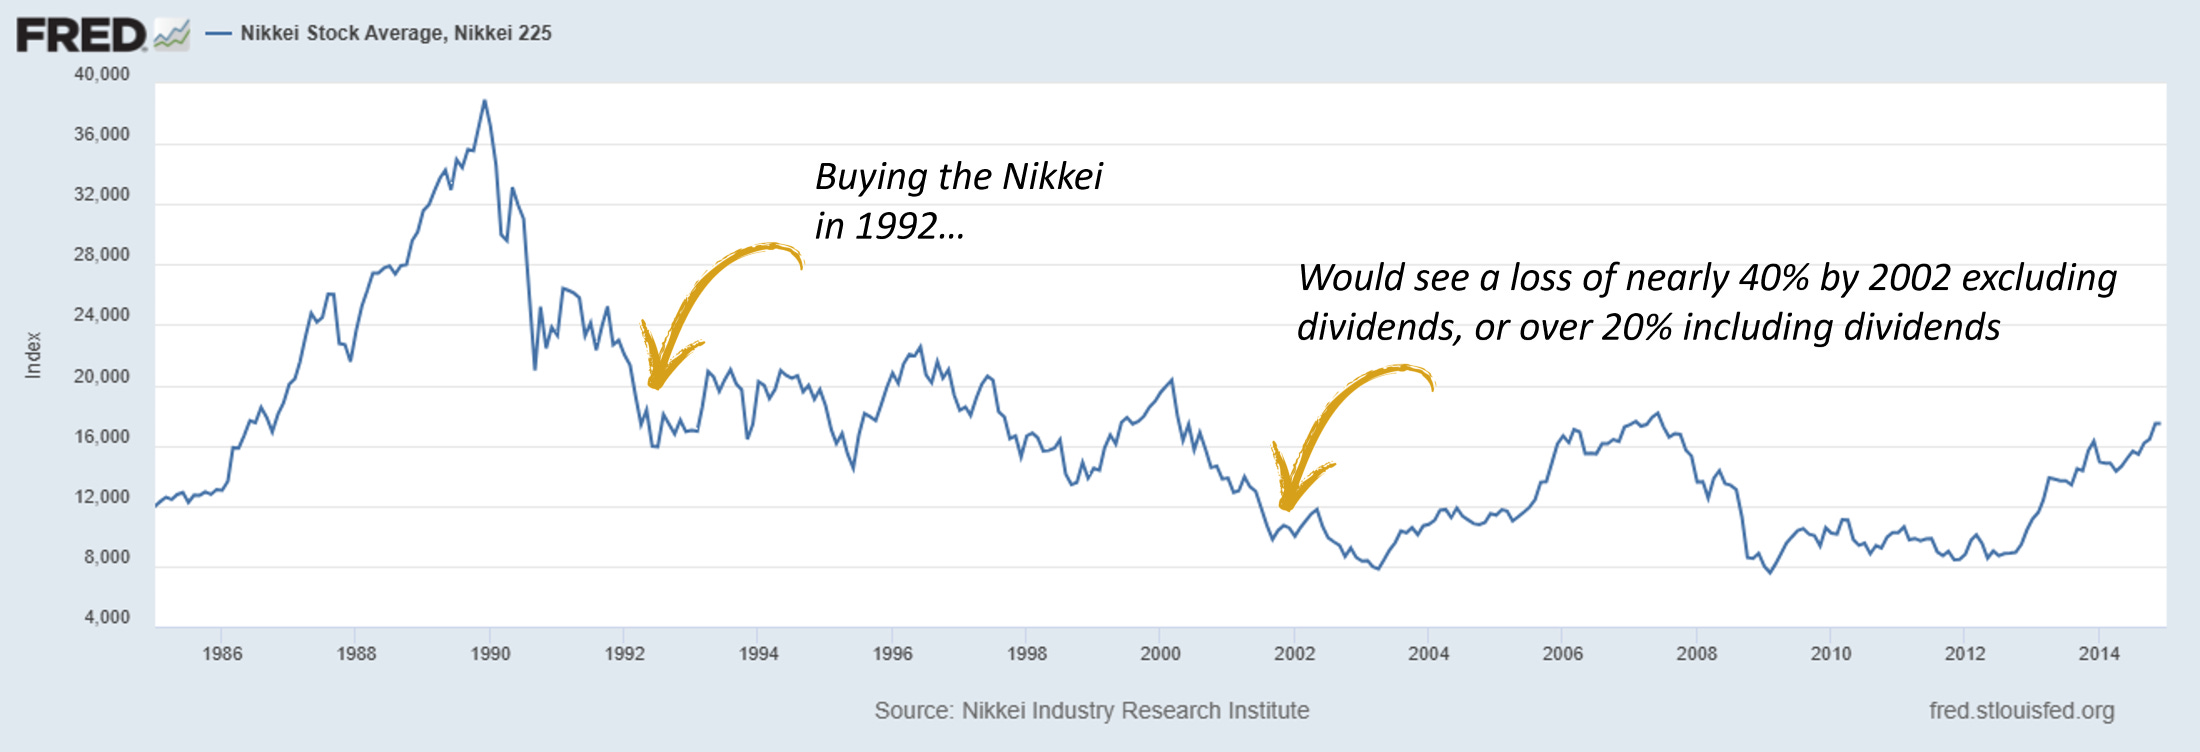
1992-2002 was a rough decade for Japanese equities, and possibly better suited to market-timers. From the chart above, the effect of the late eighties equity bubble is also quite clear.
Note that while the Japanese yen did depreciate a little against the US dollar over this time period, but it was less than 5%
Going long Italian equities in 1992 and holding until 2002 would likely have returned 200-240%, or 11-13% p.a., or around 6% p.a. in USD terms.

After dipping in 1992 and then recovering into 1994, the stock market traded sideways until late 1995, when it went into a multiyear bull, peaking in 2000, coinciding with the dotcom bubble in the US.
The Italian lira halved in value against the US dollar over the time period, towards the end of which, incidentally, the euro was adopted. In dollar terms, the Italian stock market would have returned a reasonable 6%, against close to 9% for the total US stock market over the same period.
This is rather impressive, especially since Italy’s nominal GDP in dollar terms actually decreased slightly from 1992 to 2002.
Note how we can see similar peaks around 1990, 2000 and in 2007, for both Japan and Italy - since these are from the same period, we can be more confident that movements are market-specific, rather than affecting equities across markets.
Getting into Russian equities in 1995 would have returned 200-300% by 2002 (17-21% p.a.) or 500-600% by 2005 (20-21% p.a.) in dollar terms.

Note that the above shows the dollar-denominated RTS (Russian Trading System) index, which started at 100 in 1995, when the stock trading platform was formalized. Previously, investors had to buy more as the ages.
In the meantime, investors would also have had to deal with a drawdown of well over 80% from 1997 to 1998 with the ruble devaluation and domestic debt default.
The index does not include dividends, so the TSR (total shareholders returns) would be even higher. Given its composition, however, the bulk of the returns essentially stem from a leveraged bet on energy and metals, which Russia exported.
Of course, in the meantime the Russian economy suffered as price controls were removed, and hyperinflation took hold.
It is noteworthy that despite dire economic conditions wiping out life savings for many, the stock market was still so resilient that it minted the fortunes of others.
The GFC also holds important lessons for China’s economy going forward, especially in that avoiding a liquidity crunch is key.

Although the US had more direct exposure to the GFC, the EU ironically suffered longer negative impact, partially due to a liquidity crisis triggered by the inopportune rate hikes by the ECD, even as the US subprime crisis was coming to a head.
This can be seen clearly in the chart above, which is all in dollar terms. Note that during 1996-2001, the dollar strengthened against the euro, while 2001-2008 this reversed, leading to initially a superficially flatter trajectory for EU GDP (in red), and then a steeper one leading up to the GFC.
Though US equities crashed during the GFC, it was a great time to invest - the subsequent decade and a half became a prolonged secular bull market.

An average US equity investor investing in the wake of the GFC would see a CAGR of 10-11%, or 11-12% including dividends for the following decade, just for buying and holding.
Clearly, then the key question becomes: will China’s stock market behave more like Japan’s in 1992, or America’s after 2009?
Perhaps unexpectedly, the US also offers a good comparison. The subprime crisis also racked up debt of colossal proportions, together with plummeting real estate prices.
The chart below from Business Insider shows that so far, the rate of the price decline is more similar to the US than Japan. If it does track the US decline, then we can expect prices to bottom by around 2027.

The bull case. Like US stocks in 2009, Chinese stocks are trading at multiples close to decade-long lows.
However, Chinese policymakers are unlikely to be as aggressive as the Fed in the GFC. In addition, China did not see so much of an equity bubble, meaning that investors do not have the opportunity to buy in at such a deep drawdown.
For these reasons, although China’s GDP growth should still be higher than the US from 2009-2019, our very ball park estimate for the 10-year forward TSR would tend to be more conservative, at 10% p.a.
The bear case. Like Italian stocks in 1992, Chinese stocks may trade sideways for a while, get caught up in a short and exuberant bull market, and then flounder for years.
While Italy did not have to deal with a housing price crisis, China’s GDP is growing faster as well, so the two effects may to some extent cancel out, if imperfectly.
Under this scenario, we anticipate the 10-year forward TSR for Chinese equities to be around 6% p.a.
The base case. Our base case would be between the two extremes, a 10-year forward TSR of 8% p.a.
A natural question might be - why do we not have Japan as the bear-case benchmark?
This is quite simple.
Equity bubble. Japanese equities in 1992 were still richly valued and not finished deflating, whereas Chinese equities are at very low valuations. Chinese stocks are somewhat more similarly placed to Italian stocks in 1992, which had also come off a short bull market in 1990.
Wage bubble. Japan was reliant on exports for growth; rising wages compounded by cost-of-living inflation made exports less competitive, whereas the opposite is true for China, whose exports and wages are competitive, and not pressured by rising costs of living.
The Japanese equity bubble saw numerous Japanese companies issue debt to fuel speculation in the stock market, on which many listed companies were gaining simply because of their stock investments.
The spillover into real estate and scale of the speculation is perhaps best illustrated with an anecdote.
Mitsui offered $625 million for the Exxon Building in New York in the mid 1980s, more than double the initial asking price, which had only been $310 million. It simply wanted to set the world record for paying the highest price ever for a New York office property.

Chinese companies never quite reached such giddy heights, partially because of moves against such conspicuous “investment” nearly a decade ago. Speculation in real estate was rampant, but did not directly translate over into the stock market
Using Italy as the bear case does mean having to overlook differences, such as Italy having to tighten fiscal policy to prepare for euro adoption (which is bearish), and it often running trade deficits rather than surpluses. However, on the whole the state of Italian equities is probably more comparable.
We do need to distinguish between onshore and offshore Chinese equities; global investors normally trade the former, but PRC investors normally deal in the latter.
Policy support will initially prioritize onshore Chinese equities, since this will be where the bulk of PRC retail investors would be.
As H-shares become more accessible for those investors, however, with the HK-listed stocks such as Alibaba making their way onto the Stock Connect programs, H-shares would also benefit from increased policy support.
Given that HK-listed shares for the same company often trade at up to 30-50+% discount to their A-shares, and that ADRs have similarly been hit by this pessimism, we expect slightly higher returns from those versus the onshore A-shares.
Note that these will not be perfectly smooth growth curves; we would expect at least one drawdown of 30+% over the next decade due to the nature of the capital in Chinese stocks.

Now for our discussion around sectors - global investors looking into China have generally been most interested in major themes such as:
Consumer internet
Strategic sector - AI and semiconductors
Strategic sector - EVs and clean energy
Other strategic sectors
There is overlap across the four, especially between consumer internet and AI as the big tech players are simultaneously the top clients and also potentially major hardware designers.
Strategic sectors were first announced as a priority in 2015, when the Chinese government moved against speculative outbound FDI, and tried to encourage investments into the ten “strategic sectors” below instead.
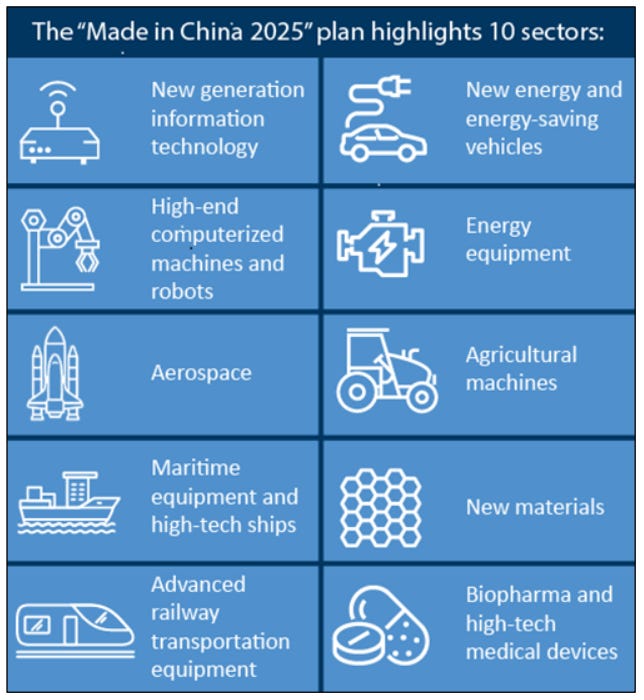
Strategic sectors will likely see secular revenue growth, but only investors prepared to do deep research should venture forth.
The solar industry provides an informative example. Even if investors caught the exact bottom of the Invesco Solar ETF (TAN) during in March 2009, they would still be down some 70% three years later in 2009.

Even today it would still struggle to match that apparent bottom, and investors would only be compensated by dividends, for an approximate TSR of 1% (and even if you timed the sale more or less perfectly, you would only get a twobagger after over a decade for a TSR of 6%).
This is because strategic sectors tend to attract a very large number of entrants in China, which quickly start to engage in price wars to take market share. This results in rapid revenue growth but margin compression.
The winners from strategic sectors can prove to be highly rewarding, much like how Southwest became a 100-bagger over the decades that most airlines lost money.
Investors in Tongwei Solar, for example, even if they missed the perfect bottom, but got in at around CN ¥4-5 (close to double what the bottom was), would be enjoying a 4- or 5-bagger (or 12-15% p.a. TSR) if they held until today, or a 10-bagger within 12 years if they sold during pandemic highs.

Investors who are able to time both the entries and the exits well would have been even better served by Longi Solar, a 50- or even 100-bagger within a decade.

These two examples show that there are indeed opportunities in strategic sectors for astute investors willing to do their homework. For underprepared investors, though, investing in such specialized sectors may incur painful losses.
Because the competition is so intense in the Chinese market, many players in strategic sectors will have an eye towards export. The effect is analogous to leverage; higher cross-border exposure may offer higher rewards, but also higher risk if trade winds turn.
Of course, not all strategic sectors are equal (or even well-defined). The correct way to gain exposure also matters.
Some that are more consumer-facing, such as “New information technology” or “medical devices”, may contain potential winners.
The “energy saving” and “new materials” sectors may contain key suppliers to consumer-facing companies.
Meanwhile, other strategic sectors such as “aerospace” and “railway equivalent” may benefit suppliers and companies that gain from lower cost of transport, for example in tourism, or manufacturers that will see lower COGS.
Apart from strategic sectors, investors should not forget that consumption will be the major growth driver going forward - a key driver for consumer stocks.

As shown in the chart above, consumption was a drag instead of driver of growth for 8/15 years after the GFC. In the decade immediately following the GFC, export growth was negative for 7/10 years, though this trend reversed over the pandemic.
However for 2023, the Chinese State Department announced that consumption drove 82% of GDP growth. The National Development and Reform Commission (NDRC) also announced support for consumption recently.
Key takeaways
Policy. Underreaction is a feature, not a bug. China observed from Japan’s experience that over-stimulus is a major risk, so it will likely continue to deliver bite-sized stimulus packages, with the aim to be just enough to maintain a safe level of liquidity, and avoid issues like the Eurozone crisis, which can hurt growth.
Timing. Real estate prices will likely still take at least another year or two to bottom, and possibly even longer. During this time, depressed interest rates combined with falling real estate prices will drive Chinese retail investors to hunt for higher yields elsewhere. Chinese equities stand to benefit, and consumer internet stocks especially - as they become accessible to PRC retail investors via the Stock Connect program.
Sectors. Strategic sectors will probably see decent revenue growth especially with policy support, yet it would be advisable to be cautious around those, due to intense competition and margin pressure. Instead, investment strategy should vary by sector.
In some sectors, direct plays may be preferable, while in others, upstream or downstream companies may be safer. Consumption will be a key driver of growth going forward, and so consumer-oriented stocks will offer ample opportunities.
China’s State Department said that >80% of GDP growth in 2023 came from consumption, while a KKR study (chart shown below) shows their optimism on China’s digitalization prospects. Together these bode well for consumer internet stocks.

Risks
Proportionality of reaction. Policymakers reacting too slowly to avoid a liquidity crunch and drag on growth, and then possibly over-stimulating.
Market efficiency and volatility. Economic growth not converting into equity growth in good time, potentially exacerbated by extreme swings in sentiment.
Trade-related uncertainties. Amid increasing trade tensions globally, companies with pureplay local market exposure will likely be safer plays - yet cross-border plays may offer higher returns.
What are your predictions for the Chinese economy, stock market, and which sectors are the best-placed? Let us know in the comments.
Full disclosure: This is not a solicitation to buy or sell. We have no current business relationships with the companies mentioned in this note, and are not paid to write this piece (other than paying fellow exponents of the research). We may buy or sell securities mentioned in this piece without notice.
Disclaimer: This should not be construed as investment advice. Please do your own research or consult an independent financial advisor. Alpha Exponent is not a licensed investment advisor; any assertions in these articles are the opinions of the contributors.